Head-to-Head Empirical Scorecard
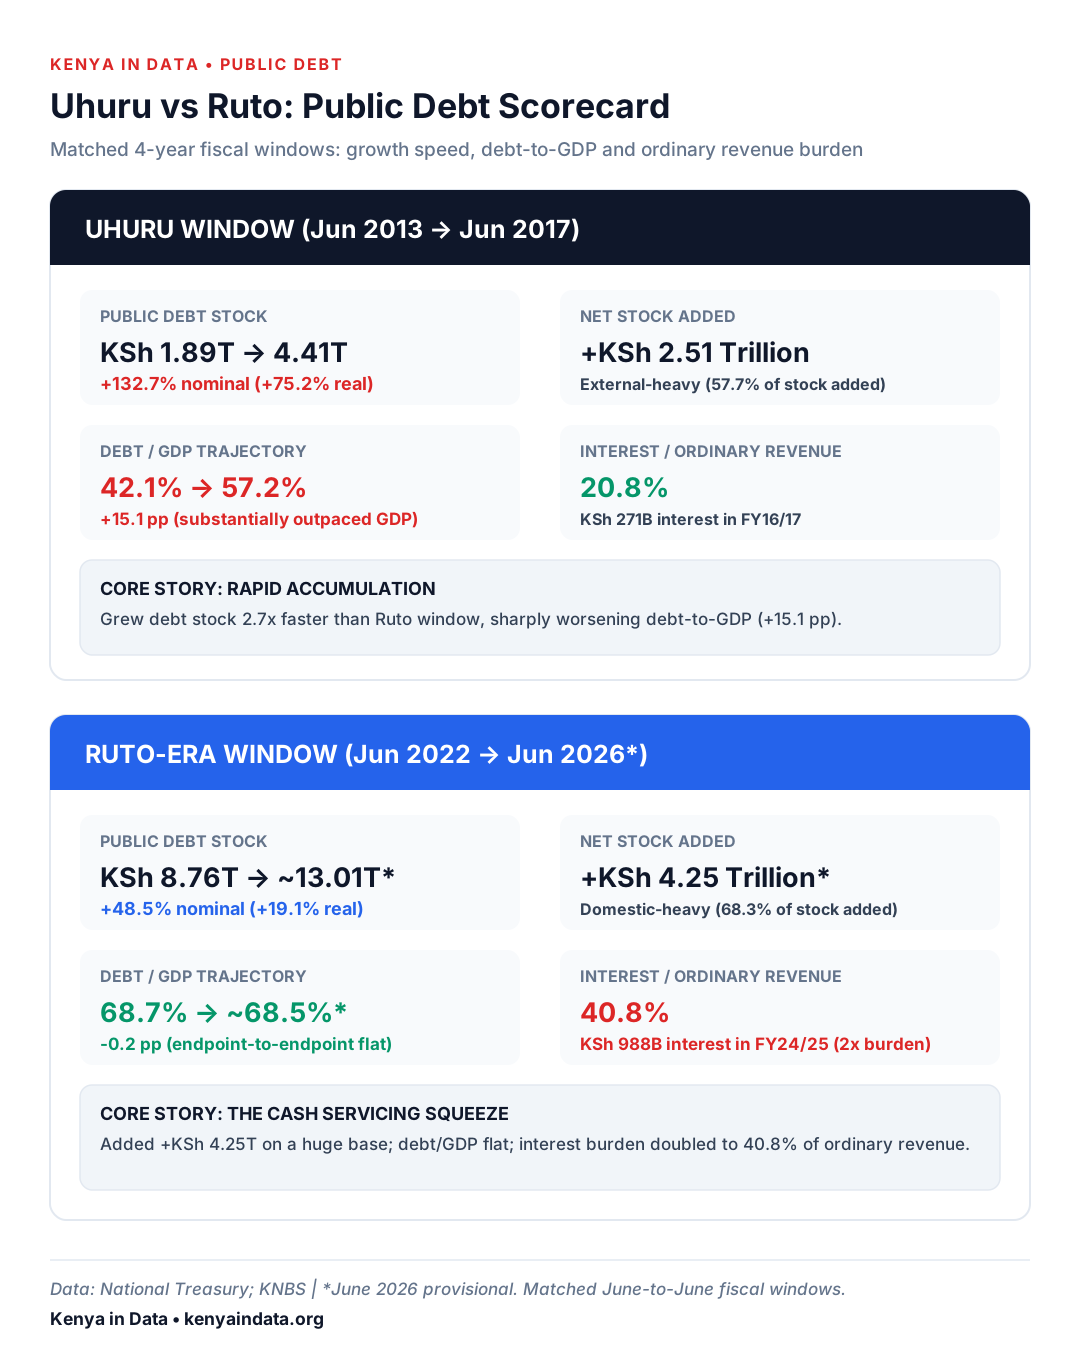
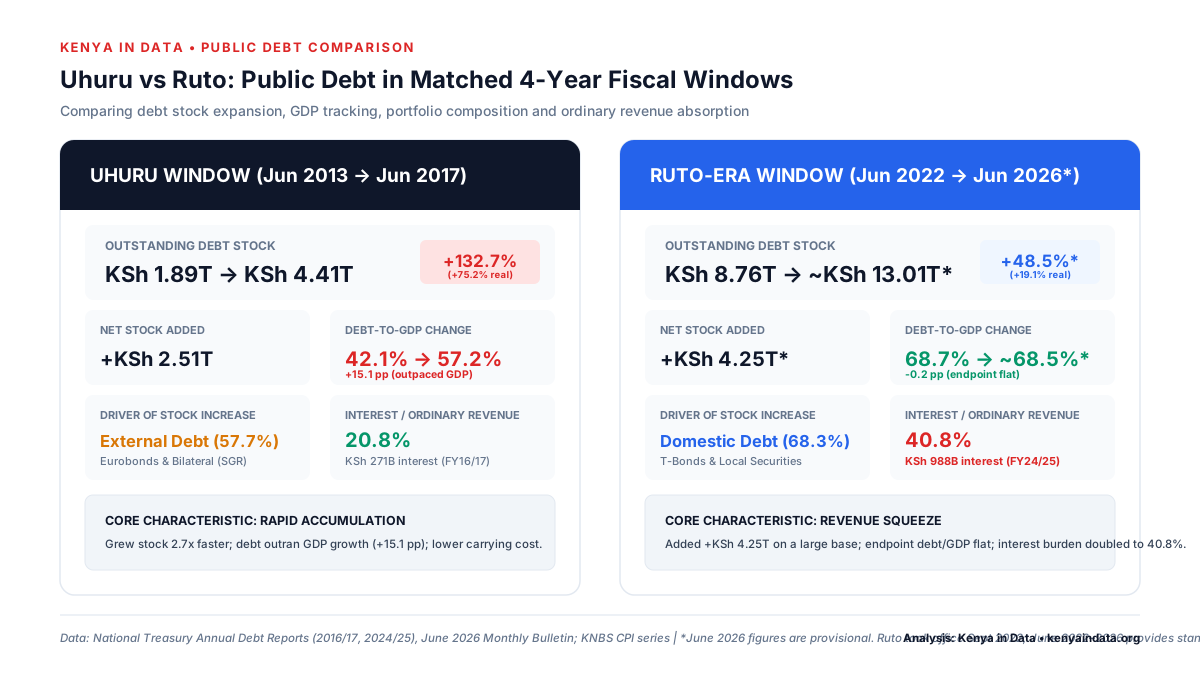
Standardized four-year June-to-June fiscal accounting snapshots allow an exact, like-for-like comparison across both administrations.
| Metric | Uhuru Window (Jun 13 → Jun 17) | Ruto Window (Jun 22 → Jun 26*) | Analytical Takeaway |
|---|---|---|---|
| Comparison Window | Jun 2013 → Jun 2017 | Jun 2022 → Jun 2026* | Standardized 4-year June fiscal windows |
| Starting Public Debt | KSh 1.894T | KSh 8.761T | Ruto window began from a 4.6× larger base |
| Ending Public Debt | KSh 4.407T | ~KSh 13.013T* | Outstanding public & guaranteed debt stock |
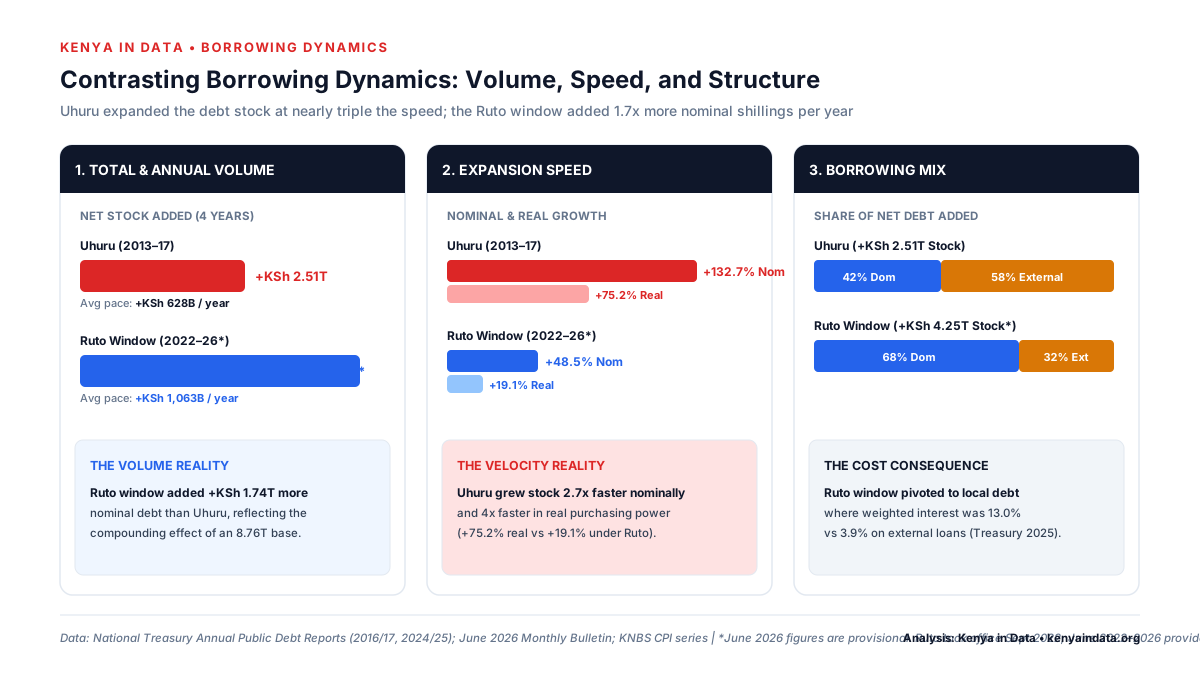
| Increase in Debt Stock | +KSh 2.513T | +KSh 4.252T | Ruto window added +KSh 1.74T more nominal stock |
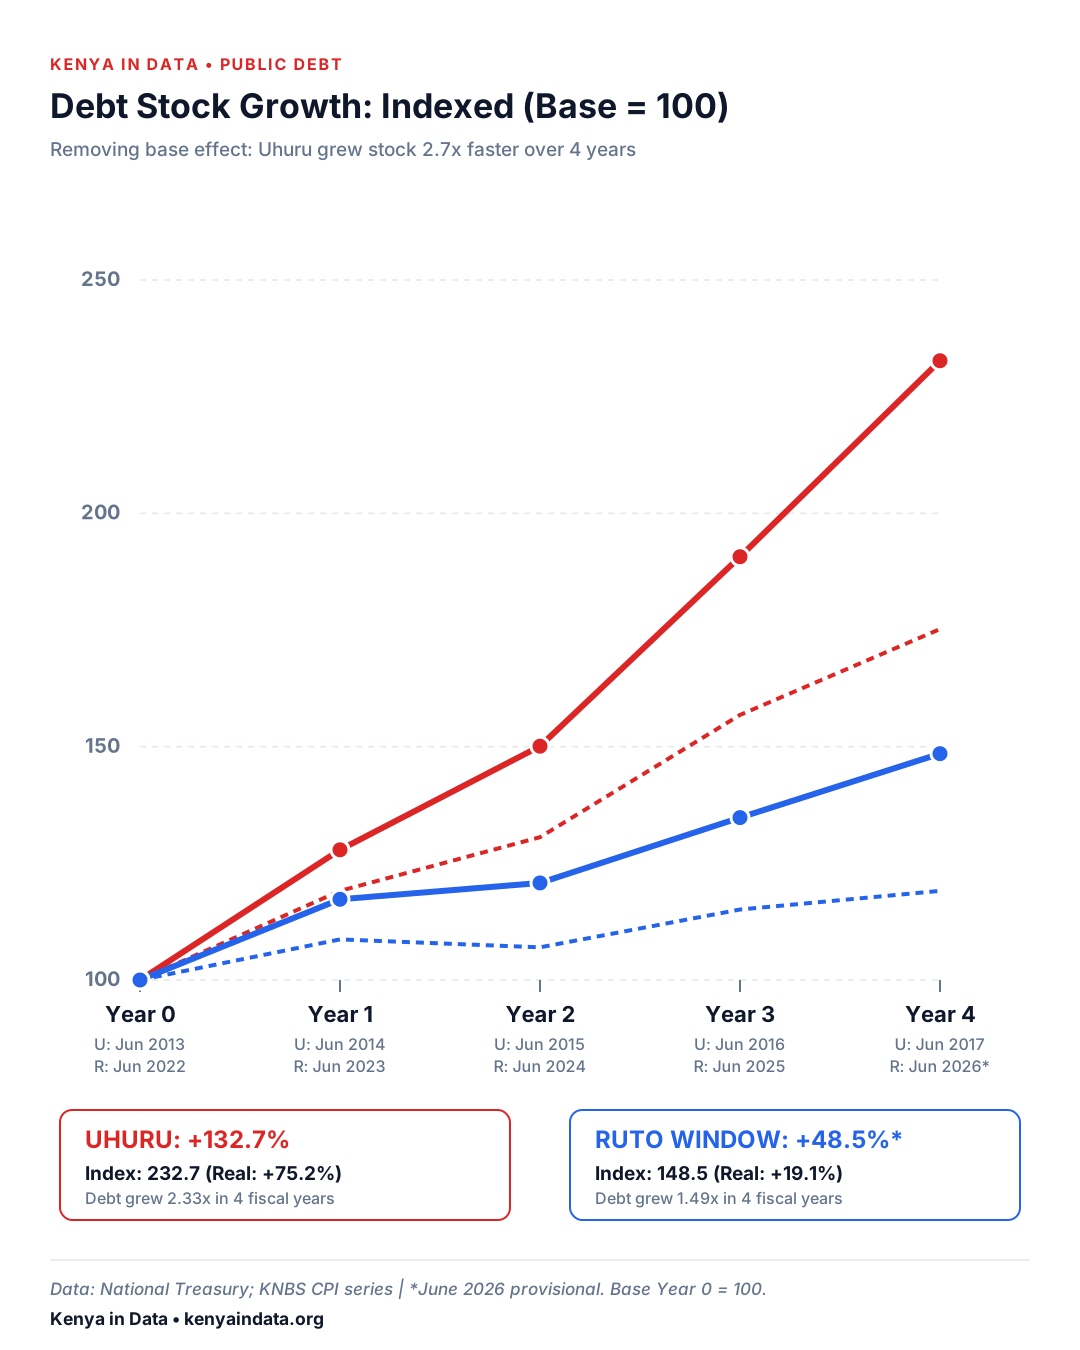
| Nominal Debt Growth | +132.7% | +48.5% | Uhuru grew the debt stock 2.7× faster |
| CPI-Adjusted Real Growth | +75.2% | +19.1% | Inflation-adjusted purchasing power expansion |
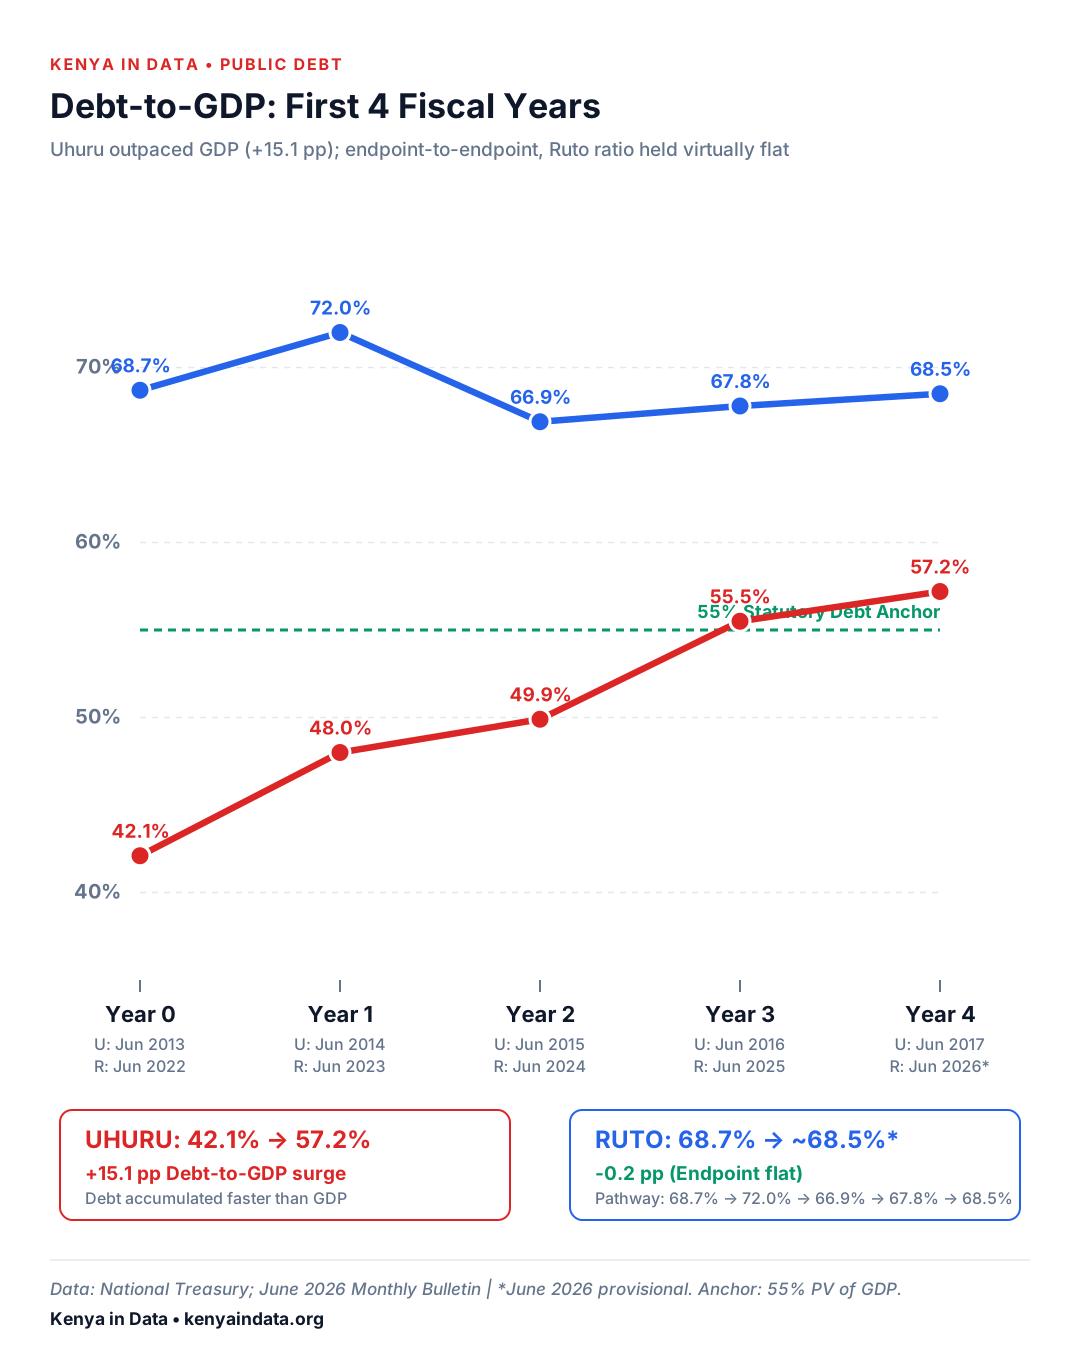
| Starting Debt / GDP | 42.1% | 68.7% | Base macroeconomic debt position |
| Ending Debt / GDP | 57.2% | ~68.5%* | Post-window debt ratio |
| Change in Debt / GDP | +15.1 pp | ~-0.2 pp* | Uhuru outpaced GDP; Ruto window endpoint flat |
| Domestic Debt Added | +KSh 1.062T (42.3%) | +KSh 2.903T (68.3%) | Ruto window pivoted heavily to local Treasury bonds |
| External Debt Added | +KSh 1.451T (57.7%) | +KSh 1.349T (31.7%) | Uhuru expansion led by Eurobonds & bilateral SGR |
| Interest / Ordinary Revenue | 20.8% (FY16/17) | 40.8% (FY24/25) | Carrying cost on national budget doubled |
| Like-for-Like Service Ratio | 23.6% | ~56.0% | Interest + External Principal / Ordinary Revenue |
1. Debt Stock: Base Effect vs Absolute Volume
Uhuru's comparison window started with a public debt stock of KSh 1.894 trillion. Four fiscal years later, that stock reached KSh 4.407 trillion. The increase was KSh 2.513 trillion, equivalent to +132.7% (a 2.33× expansion).
The Ruto-era comparison window began from a dramatically larger base: KSh 8.761 trillion in June 2022. The June 2026 Monthly Debt Bulletin puts the provisional end-June 2026 stock at approximately KSh 13.013 trillion. The four-year increase is KSh 4.252 trillion, or +48.5% (a 1.49× expansion).

2. Annual Debt Additions: The Year-by-Year Flow
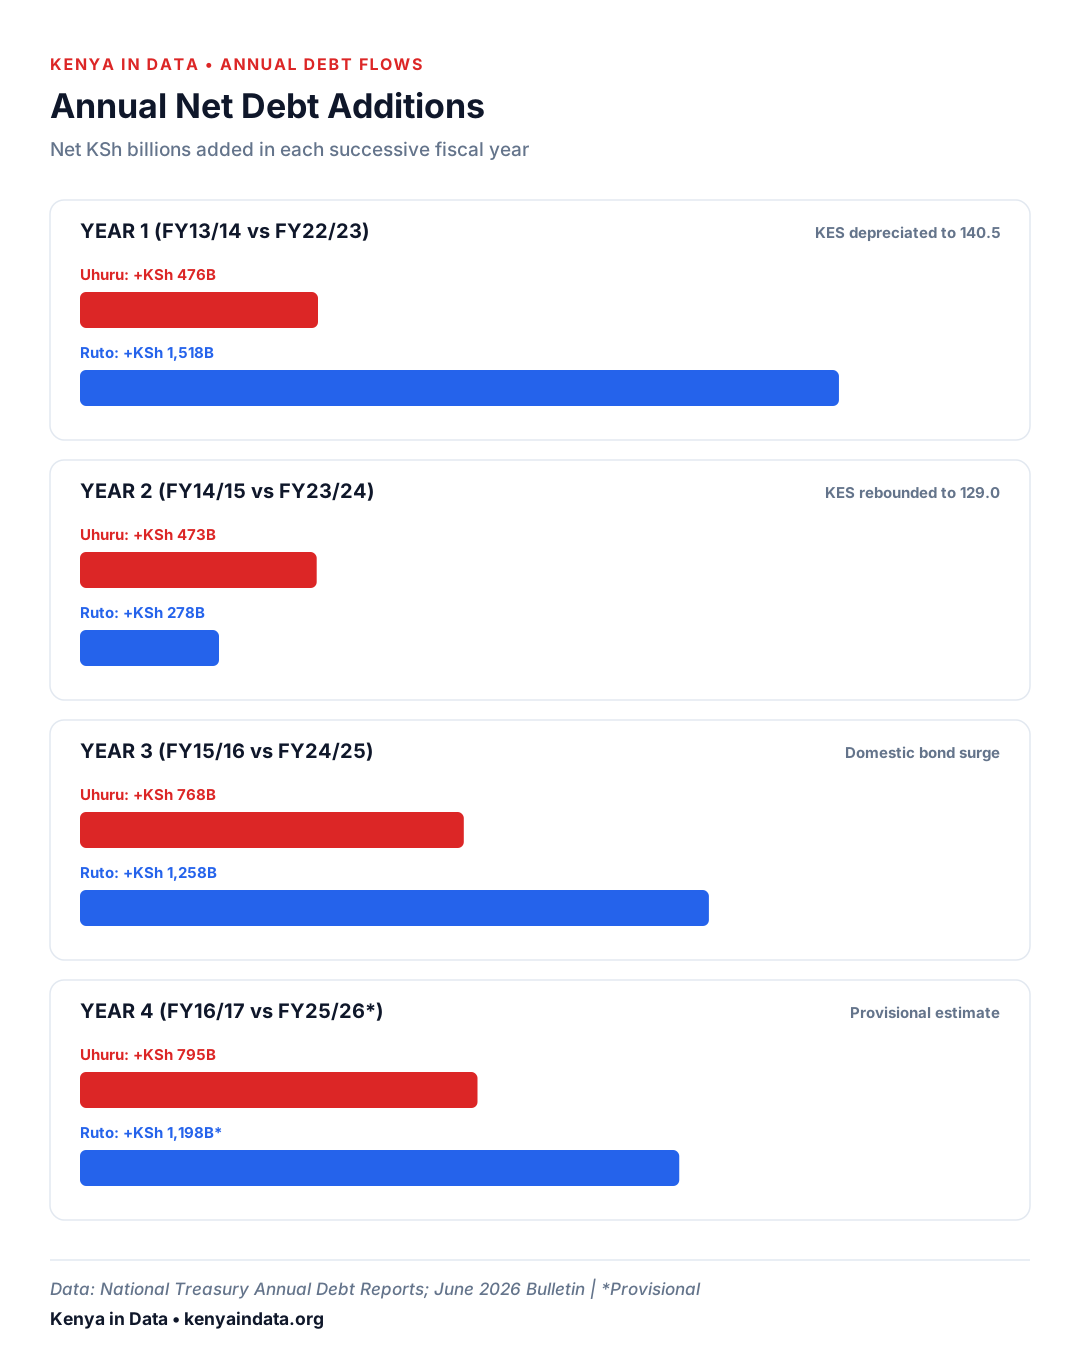
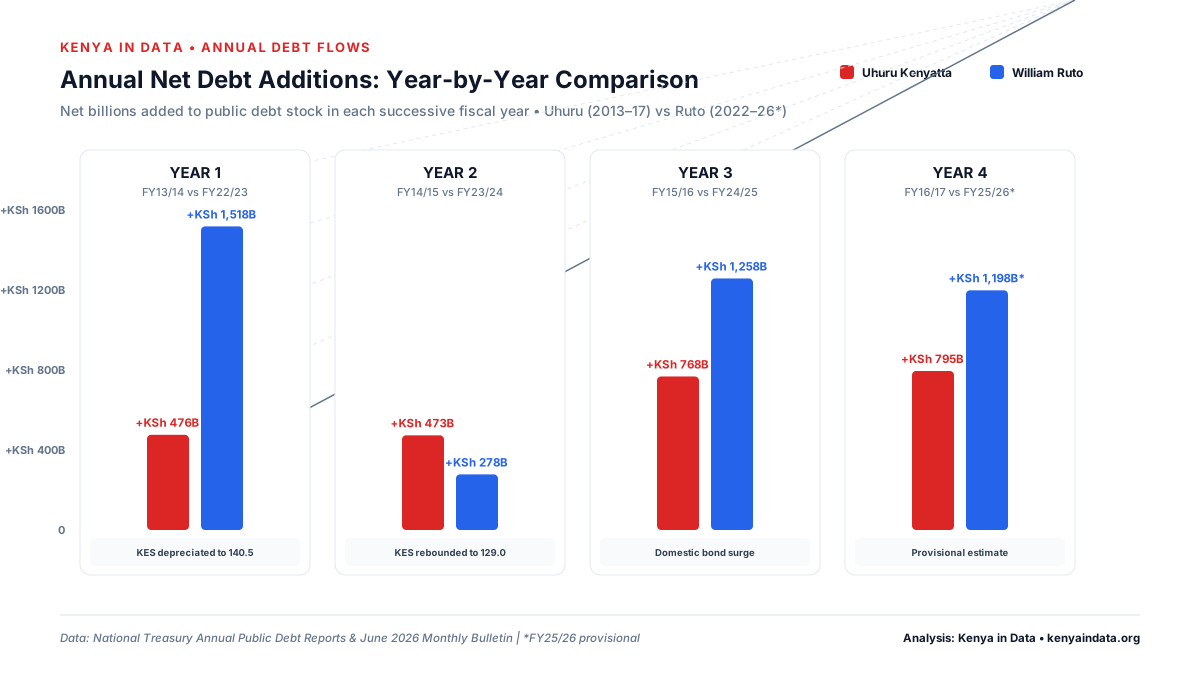
Examining the net debt added in each individual fiscal year reveals sharp structural differences in timing and external shocks:
- Ruto Year 1 (FY2022/23): Public debt spiked by +KSh 1,518 billion, heavily driven by the steep depreciation of the shilling (KES/USD moved from 117.8 to 140.5), which mechanically inflated the KSh value of existing foreign loans.
- Ruto Year 2 (FY2023/24): Debt additions slowed dramatically to just +KSh 278 billion as the shilling rebounded to 129.0 and the government executed a successful Eurobond buyback.
- Uhuru Years 1–4: Debt growth was consistent and accelerating (+KSh 476B in Year 1 $ ightarrow$ +KSh 473B in Year 2 $ ightarrow$ +KSh 768B in Year 3 $ ightarrow$ +KSh 795B in Year 4).
3. Inflation-Adjusted Growth: The Real Purchasing Power Gap
To compare the economic scale of debt accumulation fairly, nominal debt stocks must be adjusted for purchasing power using date-matched KNBS Consumer Price Index (CPI) observations.
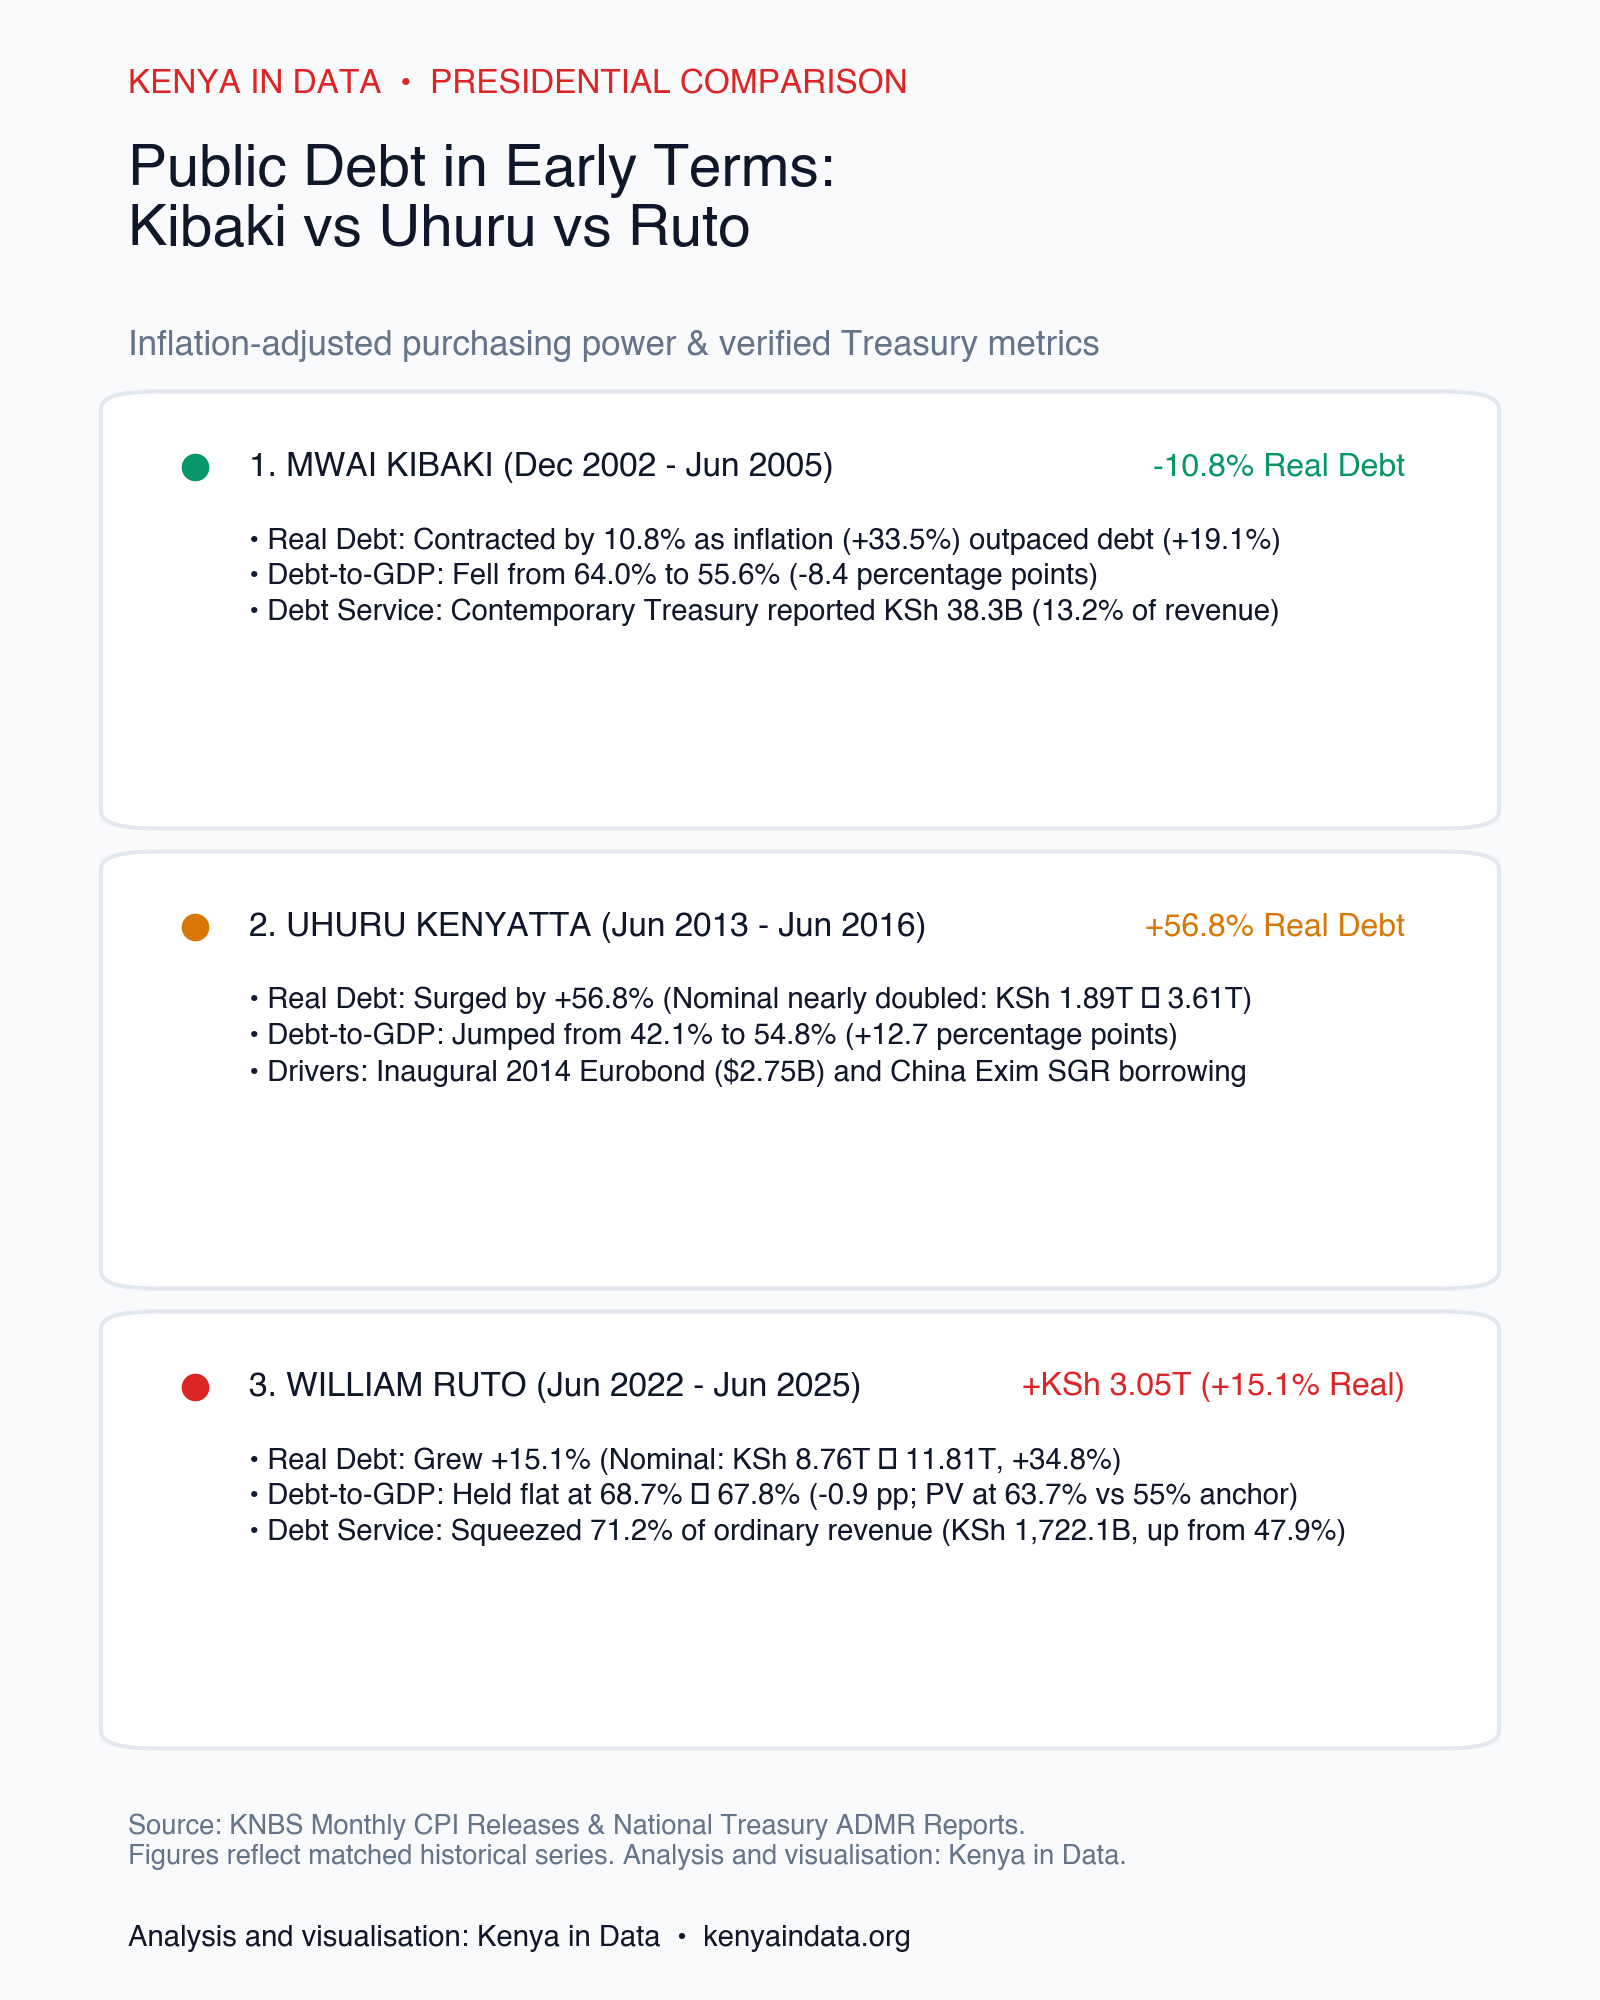
- Uhuru Window (2013–2017): CPI rose from 139.59 to 185.39 (2009=100 base). Real inflation-adjusted debt growth was +75.2%.
- Ruto Window (2022–2026): CPI rose from 124.22 to 154.91 (2019=100 base). Real inflation-adjusted debt growth was +19.1%.
In real purchasing power terms, the debt stock under Uhuru's first four fiscal years expanded at nearly four times the pace recorded in the Ruto window.

4. Debt Relative to the Economy: Outpacing Output vs Holding the Line
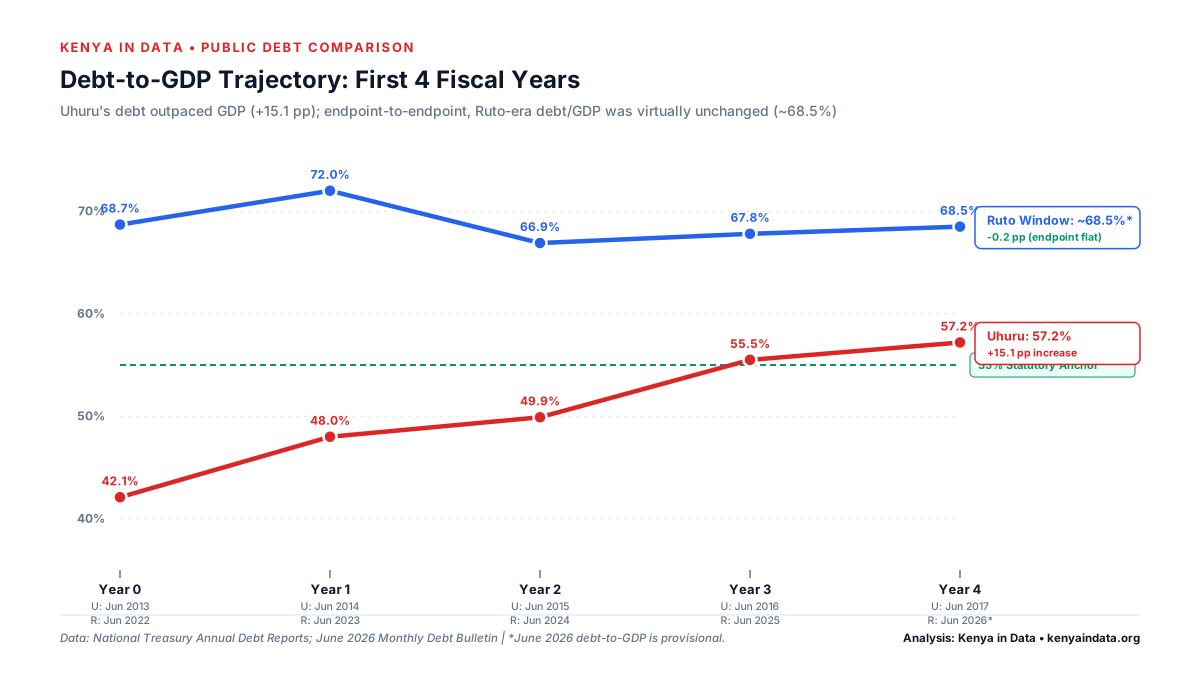
In June 2013, Kenya's public debt was equivalent to 42.1% of GDP. By June 2017, the ratio reached 57.2%—an increase of +15.1 percentage points in four years. Debt grew far faster than economic output.
Under the Ruto window, Treasury reports public debt equal to 68.7% of GDP in June 2022. The provisional June 2026 bulletin places the ratio at approximately 68.5%. Endpoint-to-endpoint, debt/GDP was virtually flat across the window (68.7% → 72.0% → 66.9% → 67.8% → ~68.5%).
5. The Composition Shift: External Financing vs Domestic Paper
The structural composition of the net increase in the debt stock diverged sharply:
- Uhuru Window: External debt accounted for 57.7% of the net debt increase (+KSh 1.451T external vs +KSh 1.062T domestic), driven by commercial Eurobonds and bilateral SGR loans.
- Ruto Window: Domestic debt accounted for 68.3% of the net debt increase (+KSh 2.903T domestic vs +KSh 1.349T external), pivoting heavily to local Treasury bonds and bills.
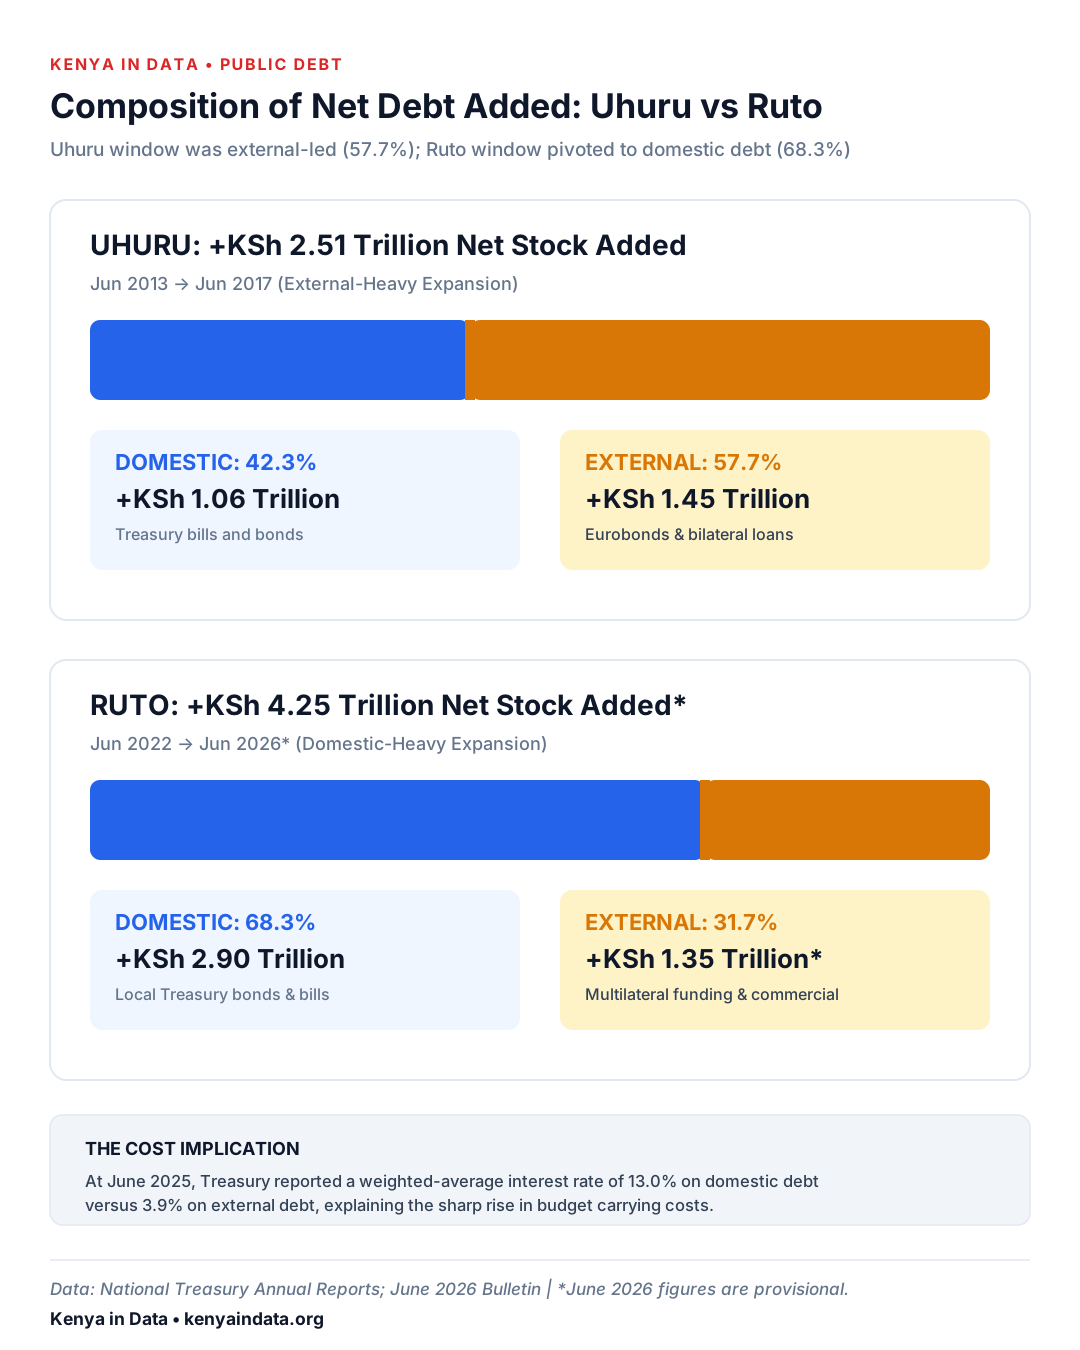
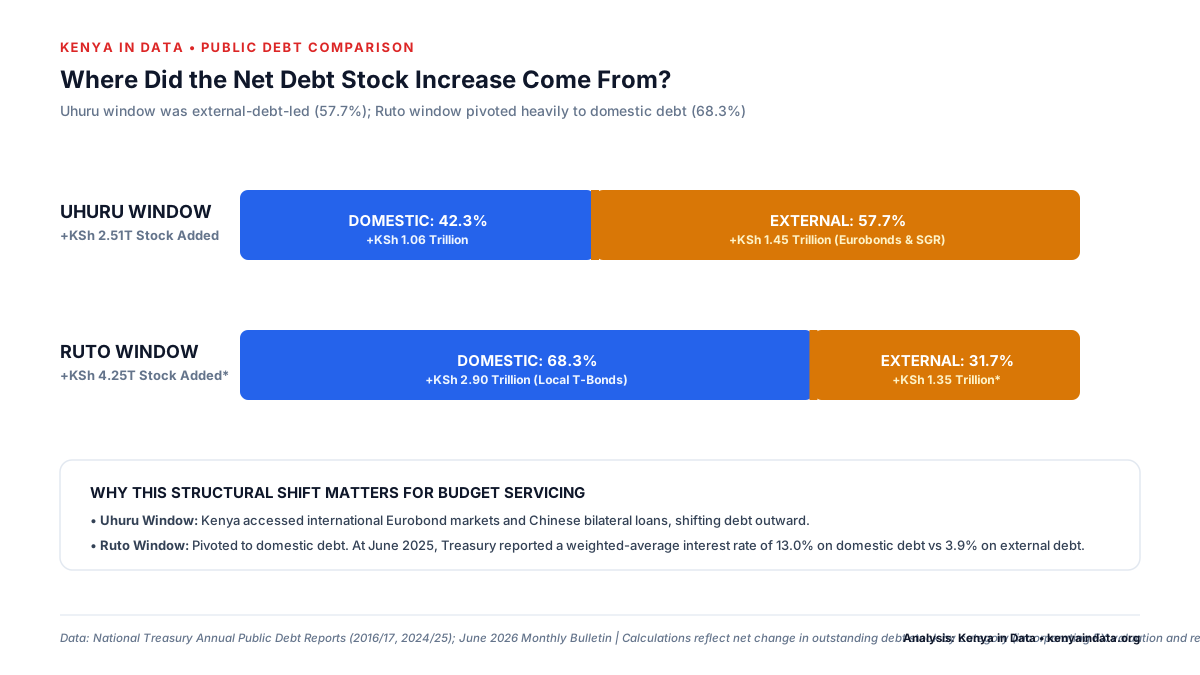
This composition shift is consequential: Treasury reports a weighted-average interest rate of 13.0% on domestic debt versus 3.9% on external debt. Shifting borrowing to domestic markets heavily increases annual cash interest obligations.
6. The Repayment Squeeze: Interest Revenue Absorption
While the debt stock grew more slowly relative to GDP across the Ruto window, debt servicing costs reached historic highs.
| Debt-Servicing Measure | Uhuru FY2016/17 | Ruto FY2024/25 Actual | Ruto FY2025/26 Projection* |
|---|---|---|---|
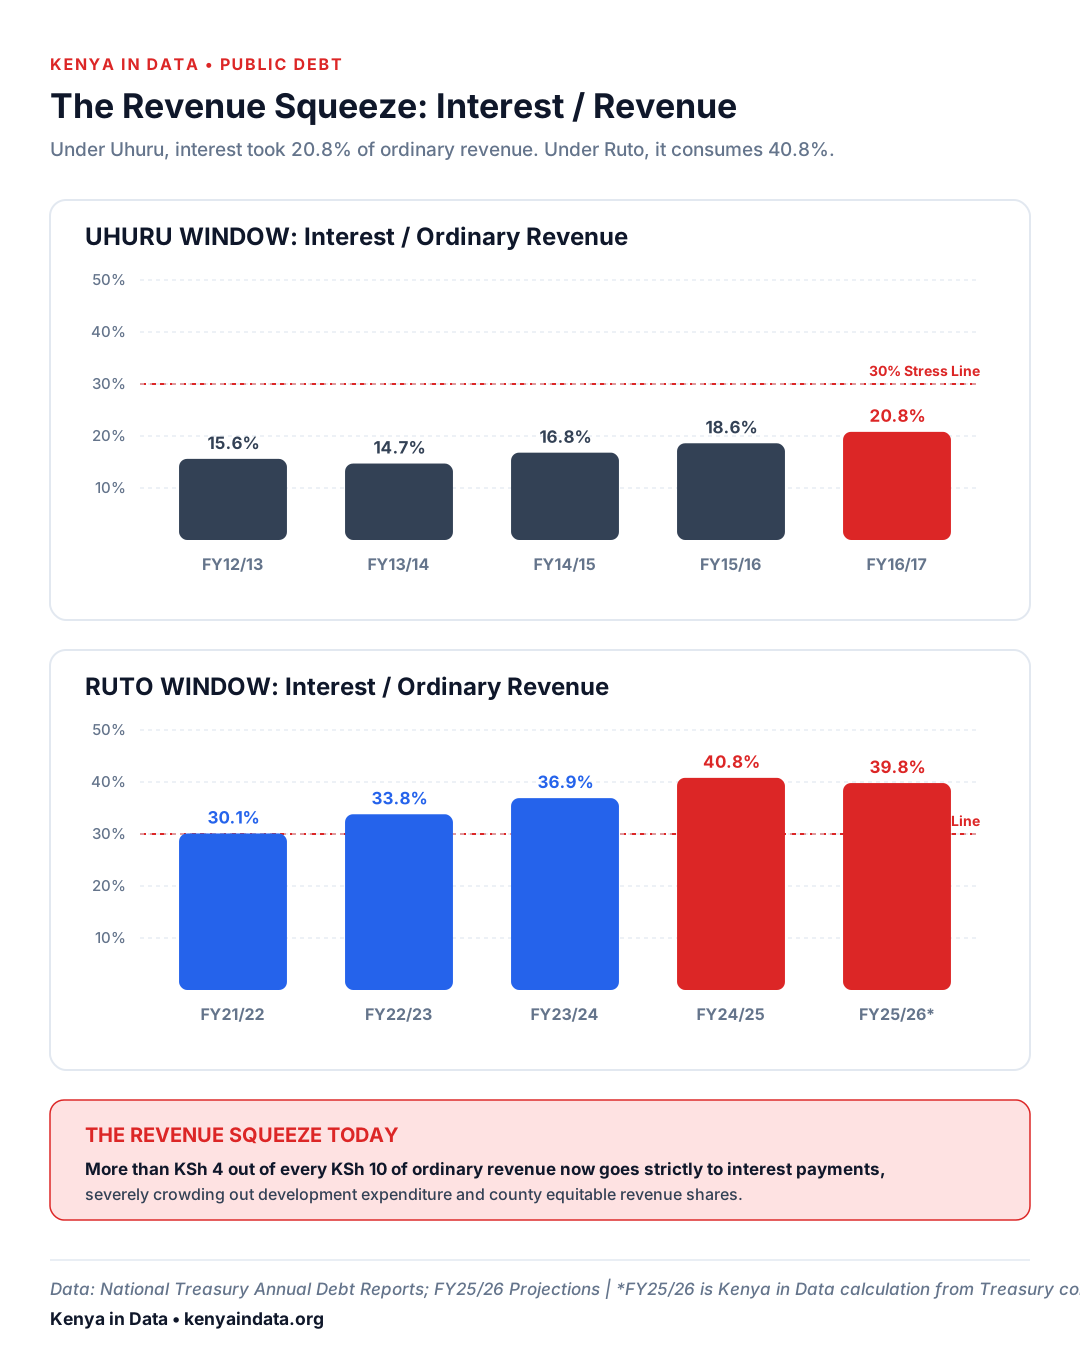
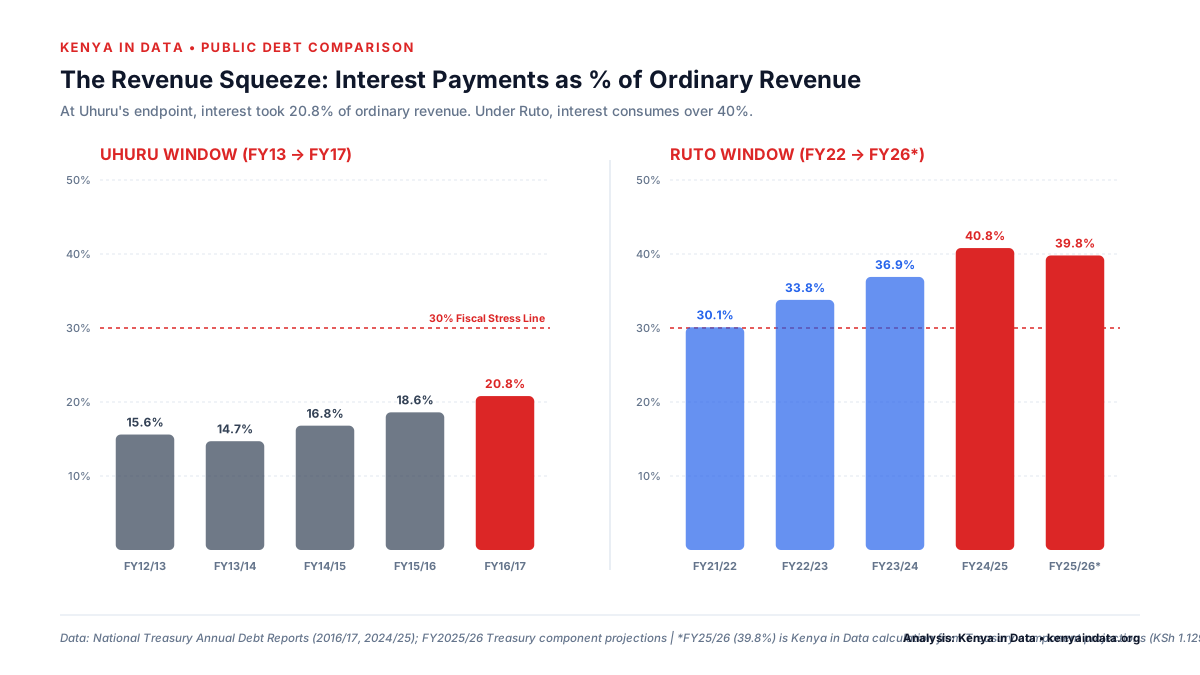
| Total Interest Paid | KSh 271.2B | KSh 987.5B | KSh 1.129T |
| Ordinary Revenue Collected | KSh 1.306T | KSh 2.420T | KSh 2.835T |
| Interest / Ordinary Revenue | 20.8% | 40.8% | ~39.8% |
| Like-for-Like Debt Service (Interest + Ext. Principal) | 23.6% | ~56.0% | ~56.7% |
| Modern Headline Service Ratio (incl. Domestic Redemptions) | Not directly comparable | 71.2% | 73.0% projected |

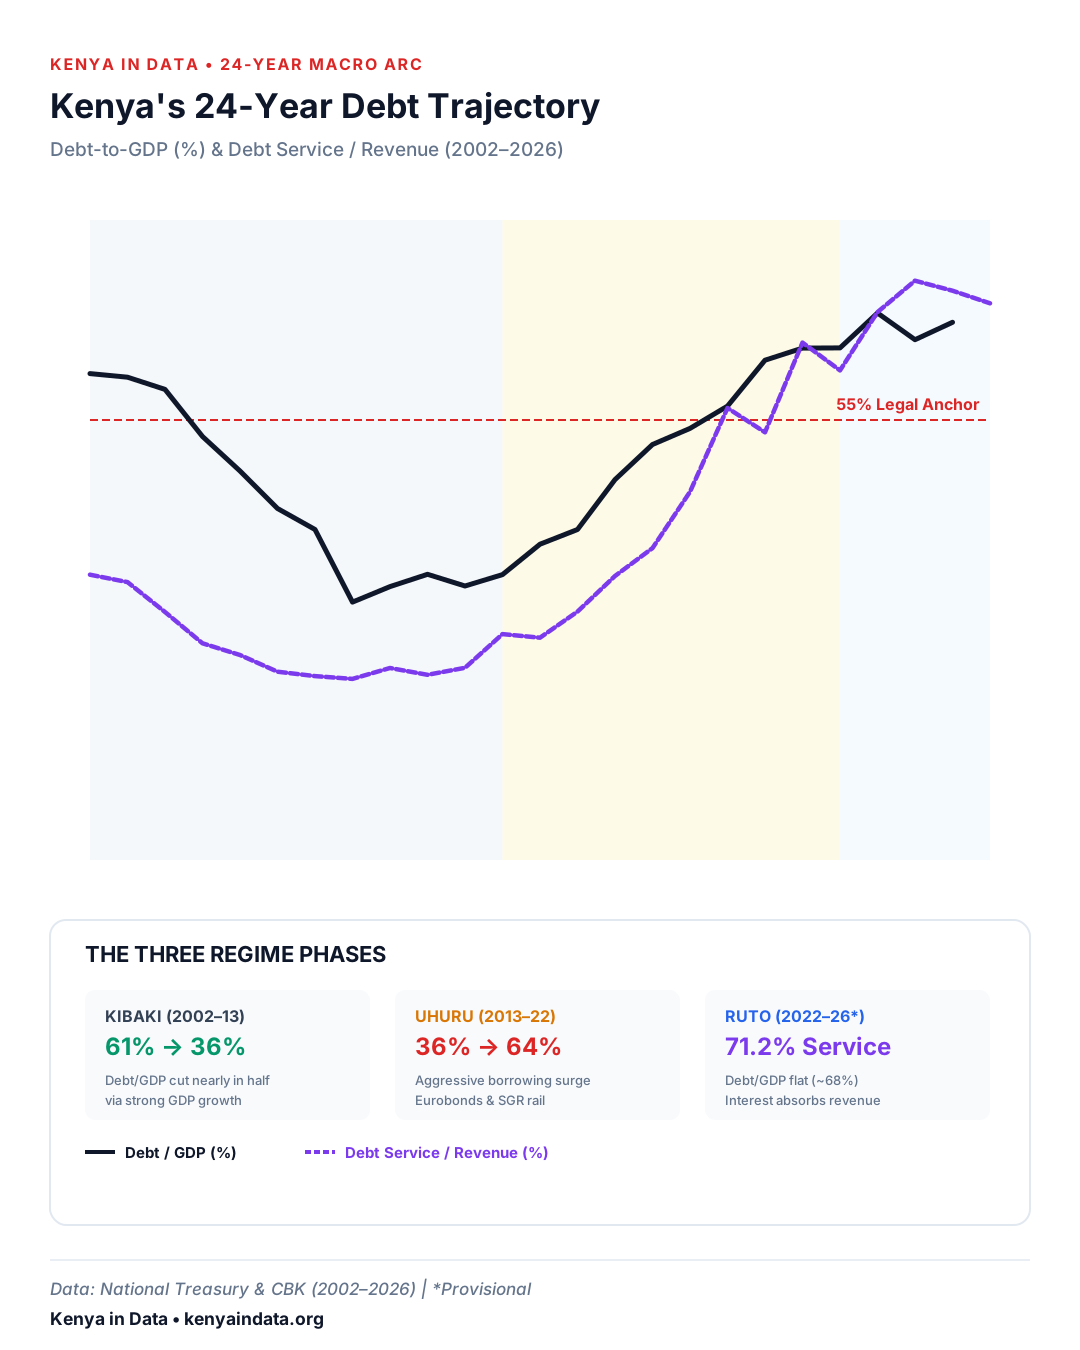
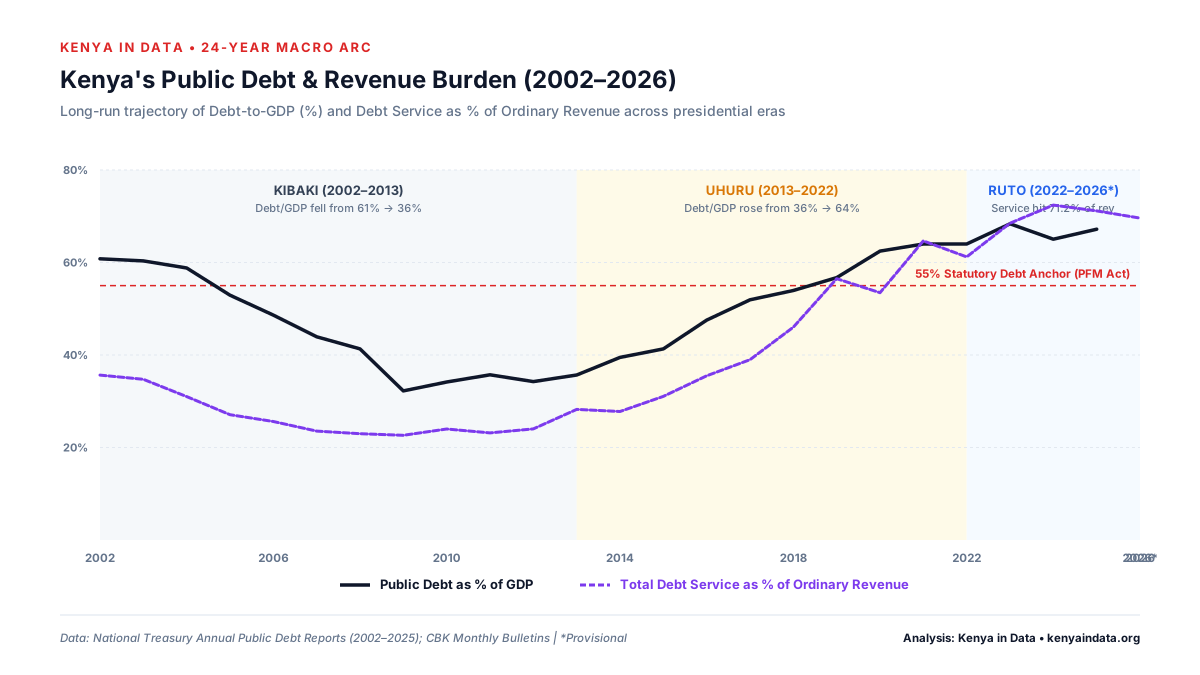
7. Long-Run Horizon: The 24-Year Arc (2002–2026)
To fully appreciate the divergence between the Uhuru and Ruto administrations, we must view both against Kenya's quarter-century macroeconomic arc:
- The Kibaki Decade (2002–2013): Strong economic growth and fiscal prudence reduced debt from 60.8% of GDP to 35.7% of GDP.
- The Uhuru Decade (2013–2022): Heavy infrastructure investments and Eurobond issuances surged debt from 35.7% of GDP to 64.0% of GDP.
- The Ruto Administration (2022–2026*): Debt/GDP has stabilized around 67%–68%, but the carrying cost peaked at 71.2% of ordinary revenue due to inherited stock size and elevated domestic interest rates.
8. Conclusion: Two Administrations, Two Different Debt Problems
The debt stock expanded rapidly (+132.7% nominal, +75.2% real), heavily driven by external borrowing (Eurobonds and SGR loans), outpacing economic growth by +15.1 percentage points of GDP.
The debt stock grew more slowly relative to GDP (endpoint-to-endpoint flat at ~68.5%), but sits atop a massive inherited balance sheet where high domestic interest rates consume over 40% of ordinary revenue.
Methodology & Data Accounting
This analysis uses matched June-to-June fiscal-year debt-stock windows rather than presidential swearing-in anniversaries:
- Fiscal Timing: Uhuru assumed office in April 2013; Ruto in September 2022. June 2013 → June 2017 and June 2022 → June 2026 provide standardized four-year fiscal accounting snapshots.
- Real Growth Deflator: Computed using KNBS monthly CPI series: 36995 ext{Real Growth} = \left( rac{ ext{Debt}_{ ext{end}}}{ ext{Debt}_{ ext{start}}} ight) imes \left( rac{ ext{CPI}_{ ext{start}}}{ ext{CPI}_{ ext{end}}} ight) - 136995 Uhuru uses the 2009=100 series (139.59 → 185.39). Ruto uses the 2019=100 series (124.22 → 154.91).
- Debt Scope: Measures net outstanding public and publicly guaranteed debt stock (including new disbursements, amortizations, repayments and FX revaluations).
Download Open Data & Assets
Kenya in Data releases all underlying observation tables and chart files under an open CC BY 4.0 license for public use, journalism, and research.
Primary Sources & References
National Treasury of Kenya (2017). Annual Public Debt Management Report 2016/2017. Tables 1-2, 1-3, pp. 12–18.
National Treasury of Kenya (2025). Annual Public Debt Report 2024/2025. Tables 4.0-1, 4.1-1 and 11.1-1, pp. 28–45.
National Treasury of Kenya (2026). June 2026 Monthly Debt Bulletin. Public Debt Management Office.
Kenya National Bureau of Statistics (2013–2017, 2022–2026). Consumer Price Indices and Inflation Rates, June observations.